
System data to hold accountability systems accountable for high-churn schools
Thanks to Luke Shepard for the chart from his blog post, “What the Chicago school ratings don’t tell you.”
Education reformers at all levels of government—federal, state, local—have focused policy in the last two decades on developing and supporting accountability systems to improve school performance. They have done so in the name of equity. Chicago Public Schools has been at the forefront of these efforts. Its accountability rating system uses multiple measures, including student growth and organizational capacity measures. The Illinois (ISBE) accountability systems follows the CPS example with some differences. Achieving equity requires we learn from these examples.
The data below compares the accountability status and ratings of stable and high-churn schools
High-churn schools have high rates of student mobility, chronic absenteeism and homelessness (students in unstable housing). For background on high-churn schools, see this policy and practice brief published by the University of Illinois Chicago.
Eve Ewing writes about the school closures that occurred in Chicago in 2013 as: “…the culmination of several generations of racist policy stacked on racist policy, each one disregarding, controlling, and displacing black children and families in new ways layered upon the callousness of the last (p. 91).” Most schools that were closed were high-churn schools.
Chapter 2: City of Losers, Ghosts in the Schoolyard
SQRP and ISBE Accountability System Data
CPS elementary schools
For an orientation to the data reported below:
There are about 125 high-churn schools in CPS (or 1/3 of all regular public schools) and 255 stable schools. The remainder are borderline-churn schools. Charter schools were not included in the analysis (comparable data was not available).
Schools aim to be in Good Standing on the accountability system. They do this by consistently earning a rating of Level 2+ and above. A Level 2 and Level 3 identifies a school for “provisional” or “intensive” support (“remediation” and “probation,” in Illinois’ authorizing legislation).
Chicago’s school improvement community—researchers and foundations as well as CPS—typically uses accountability status and ratings as a face-value measure of a school’s performance.
Schools receive a separate “accountability designation” from the Illinois State Board of Education to comply with federal ESSA legislation. ISBE’s lowest performing category is of particular interest. (Designations are used to distribute federal resources for school improvement.)
THE DATA
% CPS elementary schools in Good Standing on the accountability system in 2019:
Stable schools: 94%
High-churn schools: 47%
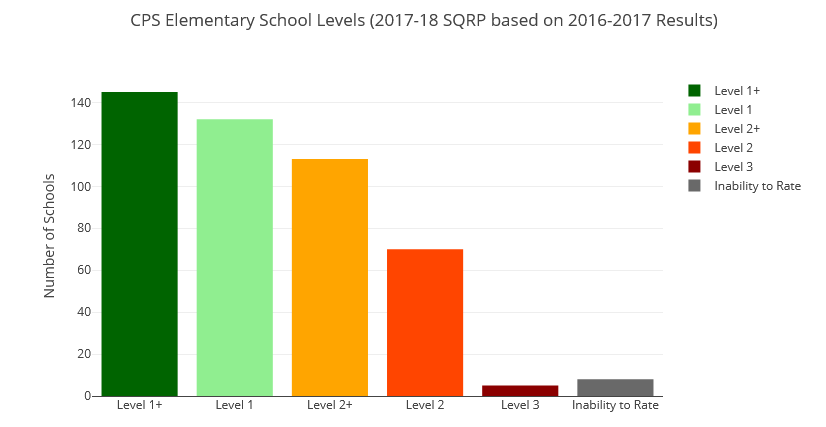
Most common accountability rating for CPS elementary schools over a five year period (2015-2019) on a five-point scale (Level 1+, Level 1, Level 2+, Level 2, Level 3):
Stable schools: Level 1+ (the top rating) is most common (45% of all ratings for the group)
High-churn schools: Level 2 (the second from the bottom rating) is most common (39% of all ratings for the group)
% elementary schools at Level 1/Level 1+ at the beginning of the five-year period (2015-2019) AND the end of the five year period for two consecutive years:
Stable schools: 53%
High-churn schools: 4%
% elementary schools at Level 1/Level 1+ at the END of the five-year period for TWO consecutive years:
Stable schools: 69%
High-churn schools: 18%
% Level 1 and Level 1+ ratings assigned over five years to:
Stable schools: 78%
High-churn schools: 34%
Comparing accountability ratings of 90% Black student enrollment schools
The overall record for the district’s 90% Black student enrollment schools indicates they are more likely to improve if they are not high-churn. 8 out of 10 schools (with 90% Black student enrollment) that were stable or borderline churn (n=45) improved over a five-year period. Of the 90% Black student enrollment schools that were high churn (n=104), fewer than half (44%) improved.
ISBE accountability data
76% of the 49 CPS elementary schools identified by the state under ESSA as lowest performing in 2019 were high-churn. The overall performance of these 37 schools was in the bottom 5% statewide.
The state identified 30% of Chicago’s high-churn schools, 15% of its borderline-churn schools and 3% of its stable schools as lowest performing.
Lowest performing schools outside Chicago are also likely to be high-churn.
42 high-churn schools in Chicago were identified by the state as commendable, but this only required their performance to fall within 95% of all schools in Illinois. Another 44 high-churn schools were identified as under-performing, typically due to the performance of the IEP subgroup.
SUMMARY
CPS SQRP Accountability System Sorts on Churn
The intersection of race, poverty, and student churn is more predictive of persistently low school performance than race and poverty alone.
Level 2+ tends to be the bottom of the system for stable schools. Only 5% of ratings for stable schools over five years were below Level 2+. High-churn schools have difficulty sustaining ratings of Level 1 and 1+ and many find it challenging to sustain a Level 2+. As a result almost all CPS stable schools, regardless of race, were in Good Standing in 2019 while less than 50% of CPS high-churn schools were in Good Standing. More than half of high-churn schools were in Provisional or Intensive support. Almost all schools in Intensive Support in recent years have been high-churn schools.
Accountability ratings have consequences for schools. This sorting negatively affects high-poverty schools that serve predominantly Black student populations. CPS uses school ratings and labels (e.g., Good Standing and Intensive Support) to steer families to their choice of schools. Schools that lose student population lose district funding. Ratings and labels are used to put schools on notice that their performance is not adequate and to shame schools in comparison to their peers. They give the district authority to take punitive action.